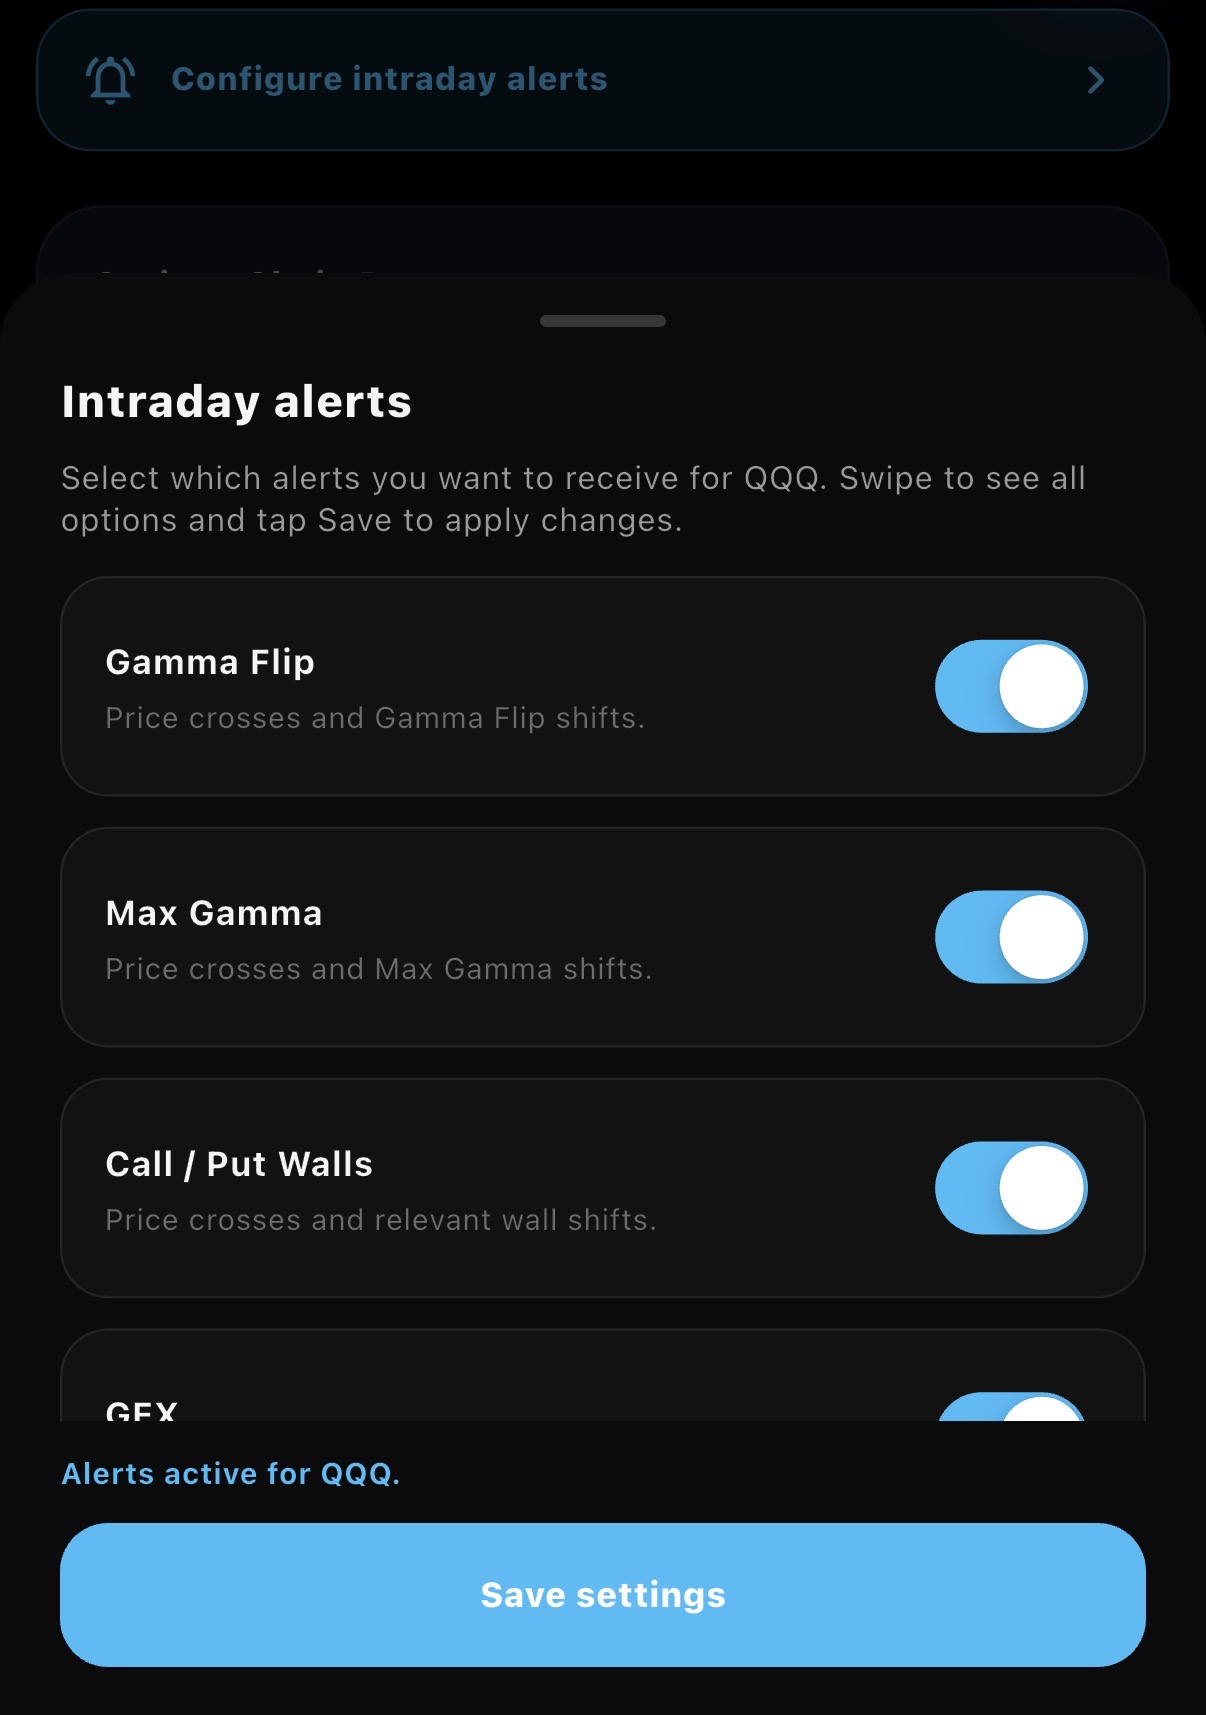
GEXfocus GEXfocus

Real-time options structure for intraday decisions.

Follow GEX, DEX, NDF, FEP, Expected Range, PCR, ATM IV, gamma levels, walls and intraday alerts from the U.S. options market. GEXfocus turns the options chain into a practical framework to read structure, flow, volatility and potential exhaustion during the session.

Real-time layer NDF, FEP and intraday alerts with Live Flow updates every 10 to 15 seconds.
Structure Gamma Flip, Zero Gamma, Max Gamma, GEX, DEX and key wall levels.
Volatility ATM IV, expected range, PCR Vol, PCR OI and session volatility context.
Signals Trend strength, structure summary and configurable alerts for selected tickers.
ProviderThetaData
Latency10–15s
MarketU.S.
CoverageSPX · QQQ · Equities
Powered by
ThetaData
Market framework

From raw options data to a consolidated read of market structure.

The objective is not to display isolated indicators. The platform combines gamma structure, delta exposure, volatility, walls, real-time flow and alerts to understand whether price is being contained, supported, rejected or pushed by hedging pressure.

Options data matters because dealers continuously hedge delta exposure in the underlying. Gamma defines how sensitive that hedge is, while delta flow helps estimate the real direction of mechanical pressure during the session.

GEXfocus organizes that information into operational blocks: static structure through GEX, DEX, Gamma Flip and walls; volatility context through ATM IV and expected range; and real-time confirmation through NDF, FEP and intraday alerts.

The result is a cleaner view of whether the market is in compression, expansion, transition, bullish confirmation, bearish divergence or exhaustion.

Structure first

Gamma levels, GEX by strike, Delta Exposure and walls identify the zones where hedging can absorb or accelerate price.

Flow as confirmation

NDF and FEP show whether price is aligned with net delta flow or trading away from the flow-based equilibrium.

Alerts to reduce monitoring

Configurable intraday alerts notify relevant shifts in Gamma Flip, Max Gamma, walls, GEX and flow conditions.

Theory foundation

Understand the logic before relying on the signal.

The platform is built around dealer hedging, gamma regime, delta flow, implied volatility and structural levels. The theory section explains the mechanics behind each indicator and how they interact during the session.

The theory page covers Delta, Gamma, dealer hedging, Gamma Flip, positive and negative gamma regimes, structural levels, expected move and the role of NDF as a real-time confirmation layer.

It is designed as a practical base for interpreting the platform, not as a generic options manual. The focus is understanding why the underlying can react around specific levels and why flow divergences can anticipate exhaustion.

Go to theory
Dealer hedging

Understand why option exposure creates real buying or selling pressure in the underlying asset.

Gamma regime

Learn why positive gamma tends to compress volatility and negative gamma can amplify movement.

Flow confirmation

Use NDF and FEP to validate whether the move is supported by real-time hedging pressure.

Intraday options intelligence

Structure, flow, volatility, and alerts inside one platform.

GEXfocus brings together key levels, gamma and delta exposure, real-time flow, implied volatility, and intraday alerts to follow the market with a cleaner read and less dependence on isolated metrics.

Intraday options alerts configuration
Intraday alerts

Configurable intraday alerts

Gamma Flip · Max Gamma · Walls · GEX · NDF

Select the alerts you want to receive for a ticker and reduce manual monitoring during the session. The system is designed to notify relevant changes in structure and flow instead of forcing constant screen watching.

  • Alerts by ticker for selected intraday conditions
  • Gamma Flip, Max Gamma and wall shift monitoring
  • Useful for active users following real-time structure
Available for real-time subscribers
Expected range and options walls
Volatility and walls

Expected Range and Walls

ATM IV · Expected Move · Call Wall · Put Wall · Max Pain

This block converts ATM IV into an expected intraday range and pairs it with relevant options walls. It gives a direct reference for probable movement, distance to walls and zones where positioning may create friction.

  • Expected move based on ATM implied volatility
  • Minimum and maximum projected range
  • Call Wall, Put Wall and Max Pain with distance to spot
Flow Equilibrium Price
Live Flow plan

Session FEP

Flow Equilibrium Price

FEP estimates the equilibrium level between price and Net Delta Flow. When price trades above FEP, the session has a more constructive flow bias; when it trades below, the read can shift toward weaker alignment.

  • Price versus flow-equilibrium reference
  • Bias read when price moves above or below FEP
  • Complements NDF by adding a price-level reference
Designed for intraday confirmation
Gamma levels and Put Call Ratio
Core structure

Gamma Levels and PCR

Zero Gamma · Gamma Flip · Max Gamma · Total GEX · PCR

A compact read of the levels that define the gamma regime, plus Put/Call Ratio by volume and open interest. It helps determine whether the environment is structurally stable, defensive, or vulnerable to higher volatility.

  • Zero Gamma, Gamma Flip and Max Gamma levels
  • Total GEX and gamma zone concentration
  • PCR Vol and PCR OI to compare calls versus puts
Gamma map by strike and expiration
Structure map

Gamma Map

Strike · Expiration · Concentration

A matrix view of gamma concentration across strikes and expirations. It helps identify where structural pressure is clustered and which price zones may behave as relevant support, resistance or attraction areas.

  • Strike-by-expiration gamma concentration
  • Reference spot price and latest update time
  • Useful for locating relevant zones across the chain
Net Delta Flow session chart
Live Flow plan

Session NDF

Accumulated Net Delta Flow · Divergence windows

NDF tracks accumulated net delta flow in real time and compares it against price. It is especially useful when price and flow align for confirmation or when they diverge and the move starts showing signs of exhaustion.

  • Accumulated net delta flow in dollar terms
  • Multiple time windows for divergence detection
  • Bullish or bearish confirmation when price and flow align
Exclusive to the Live Flow plan
Intraday trend strength and structure summary
Decision summary

Trend Strength and Structure Summary

Bias score · Regime tags · Signal clustering

A consolidated read of current market structure. It groups signals such as gamma dominance, delta dominance, PCR, IV ATM, NDF and FEP into a cleaner intraday score and regime summary.

  • Intraday trend strength score from 0 to 12
  • Structure tags for gamma, delta, PCR, IV and NDF
  • Quick read of whether signals are aligned or mixed
Delta Exposure by strike
Directional exposure

Delta Exposure by Strike

Net Delta · Call Dominance · Max Delta

A strike-by-strike view of net delta exposure. It helps identify whether the chain is dominated by call-side or put-side exposure and where the strongest directional pressure is concentrated.

  • Net delta exposure across strikes
  • Call or put dominance inside the chain
  • Max Delta and spot references for context
Gamma Exposure by strike
Gamma regime

Gamma Exposure by Strike

GEX · Call Dominance · Max Gamma · Spot

A distribution of positive and negative gamma by strike. It shows where the gamma regime is concentrated and whether the current environment is more likely to compress intraday volatility or amplify movement.

  • Positive and negative GEX by strike
  • Call dominance and Max Gamma references
  • Spot marker to locate price inside the gamma structure
PCR and IV session
Volatility context

PCR / IV Session

PCR Vol · PCR OI · ATM IV

An intraday evolution of Put/Call Ratio and ATM implied volatility. It helps detect whether the session is gaining defensive pressure, losing volatility, or staying in a more balanced and sideways environment.

  • PCR by volume and open interest through the session
  • ATM IV evolution for volatility context
  • Signal box to classify trending or undefined conditions
MCP integration with Claude
Available on all tiers

MCP Integration with Claude

Model Context Protocol

Connect GEXfocus directly to Claude to query gamma structure, delta flow, PCR, key levels, macro context, and market data in natural language without leaving your workflow.

  • Query GEX, NDF, FEP, PCR and macro data through AI
  • Secure authentication and simple setup
  • Tool access based on subscription tier
Available on all plans, with permissions based on tier
Learn more
GEXfocus real-time low-latency market data
Low-latency data

Real-time intraday dashboards

Day trading · Intraday structure · 5-second refresh

GEXfocus is built for active intraday workflows, with low-latency market data and dashboard refreshes every 5 seconds inside the intraday and day-trading environment. The goal is simple: fast options-structure reads, competitive pricing, and no compromise on data quality.

  • Low-latency data for active session monitoring
  • Dashboard updates every 5 seconds in intraday views
  • Competitive pricing without reducing data quality
Infrastructure

Low-latency data for a read you can actually use during the session.

The platform is built on U.S. options market data and designed for real intraday use. The value is not only seeing the chain, but tracking changes frequently enough to keep the structure actionable.

GEXfocus combines full-chain structure with real-time flow analysis. The delayed plan gives access to the core structure, while the Live Flow plan adds lower-latency updates, NDF, FEP, and active intraday monitoring.

This makes it possible to read the market from multiple angles: where exposure is concentrated, whether volatility is being compressed, where walls are located, how delta exposure is distributed, and whether price is aligned with real-time hedging pressure.

The objective is to reduce noise and make options structure usable for equities, ETFs and index trading, even for users who do not trade options directly.

10–15s

Target update speed of the Live Flow plan for intraday structure and flow tracking.

15 min

Delay used by the Advanced Indicators plan for core options-structure data.

0DTE

Support for short-dated expirations where intraday hedging pressure can be more relevant.

9+

Core modules covering GEX, DEX, NDF, FEP, PCR, IV, walls, range and alerts.

Platform under active development. Indicators, visualizations and workflows may evolve over time. Accuracy improvements, new views, alert logic or interface changes may be introduced as the platform develops and subscriber feedback is incorporated.
Frequently asked questions

The essentials behind the new intraday options workflow.

These questions explain how the main indicators should be interpreted and why they matter when reading equities, ETFs or index movement through options structure.

What is Gamma Exposure (GEX)?

GEX summarizes the net gamma exposure of the options market. Positive gamma tends to support volatility compression, while negative gamma can make price moves more unstable or amplified.

What is Delta Exposure (DEX)?

DEX shows how directional exposure is distributed across strikes. It helps identify whether the chain is dominated by call-side or put-side delta and where directional pressure is concentrated.

What is Net Delta Flow (NDF)?

NDF tracks accumulated net delta flow during the session. It is useful for spotting confirmation, divergence or exhaustion when price and flow stop moving together.

What is FEP?

FEP is the Flow Equilibrium Price. It estimates a reference level between price and NDF, helping classify whether price is trading above or below the flow-based equilibrium.

What do Expected Range and Walls measure?

Expected Range uses ATM IV to estimate a probable movement zone, while Call Wall, Put Wall and Max Pain identify relevant options-positioning levels around price.

Do I need to trade options for this to be useful?

No. Dealer hedging affects the underlying asset, so gamma structure, delta exposure, NDF, FEP, PCR and IV can add context to equities, ETFs and index trading.

Plans

Access the data at the depth and speed that fit your workflow.

Both plans include access to the platform. The main differences are latency, real-time flow tools, intraday alerting and the depth of active-session monitoring.

Advanced Indicators

Structure and context with delayed data

$7
per month · auto-renewing

Includes GEX, DEX, gamma levels, PCR, ATM IV, expected range, walls, dominance and macro data. It is the foundation for users who want options structure without needing full real-time access.

View subscription